Console
Resolve Incidents in Bulk
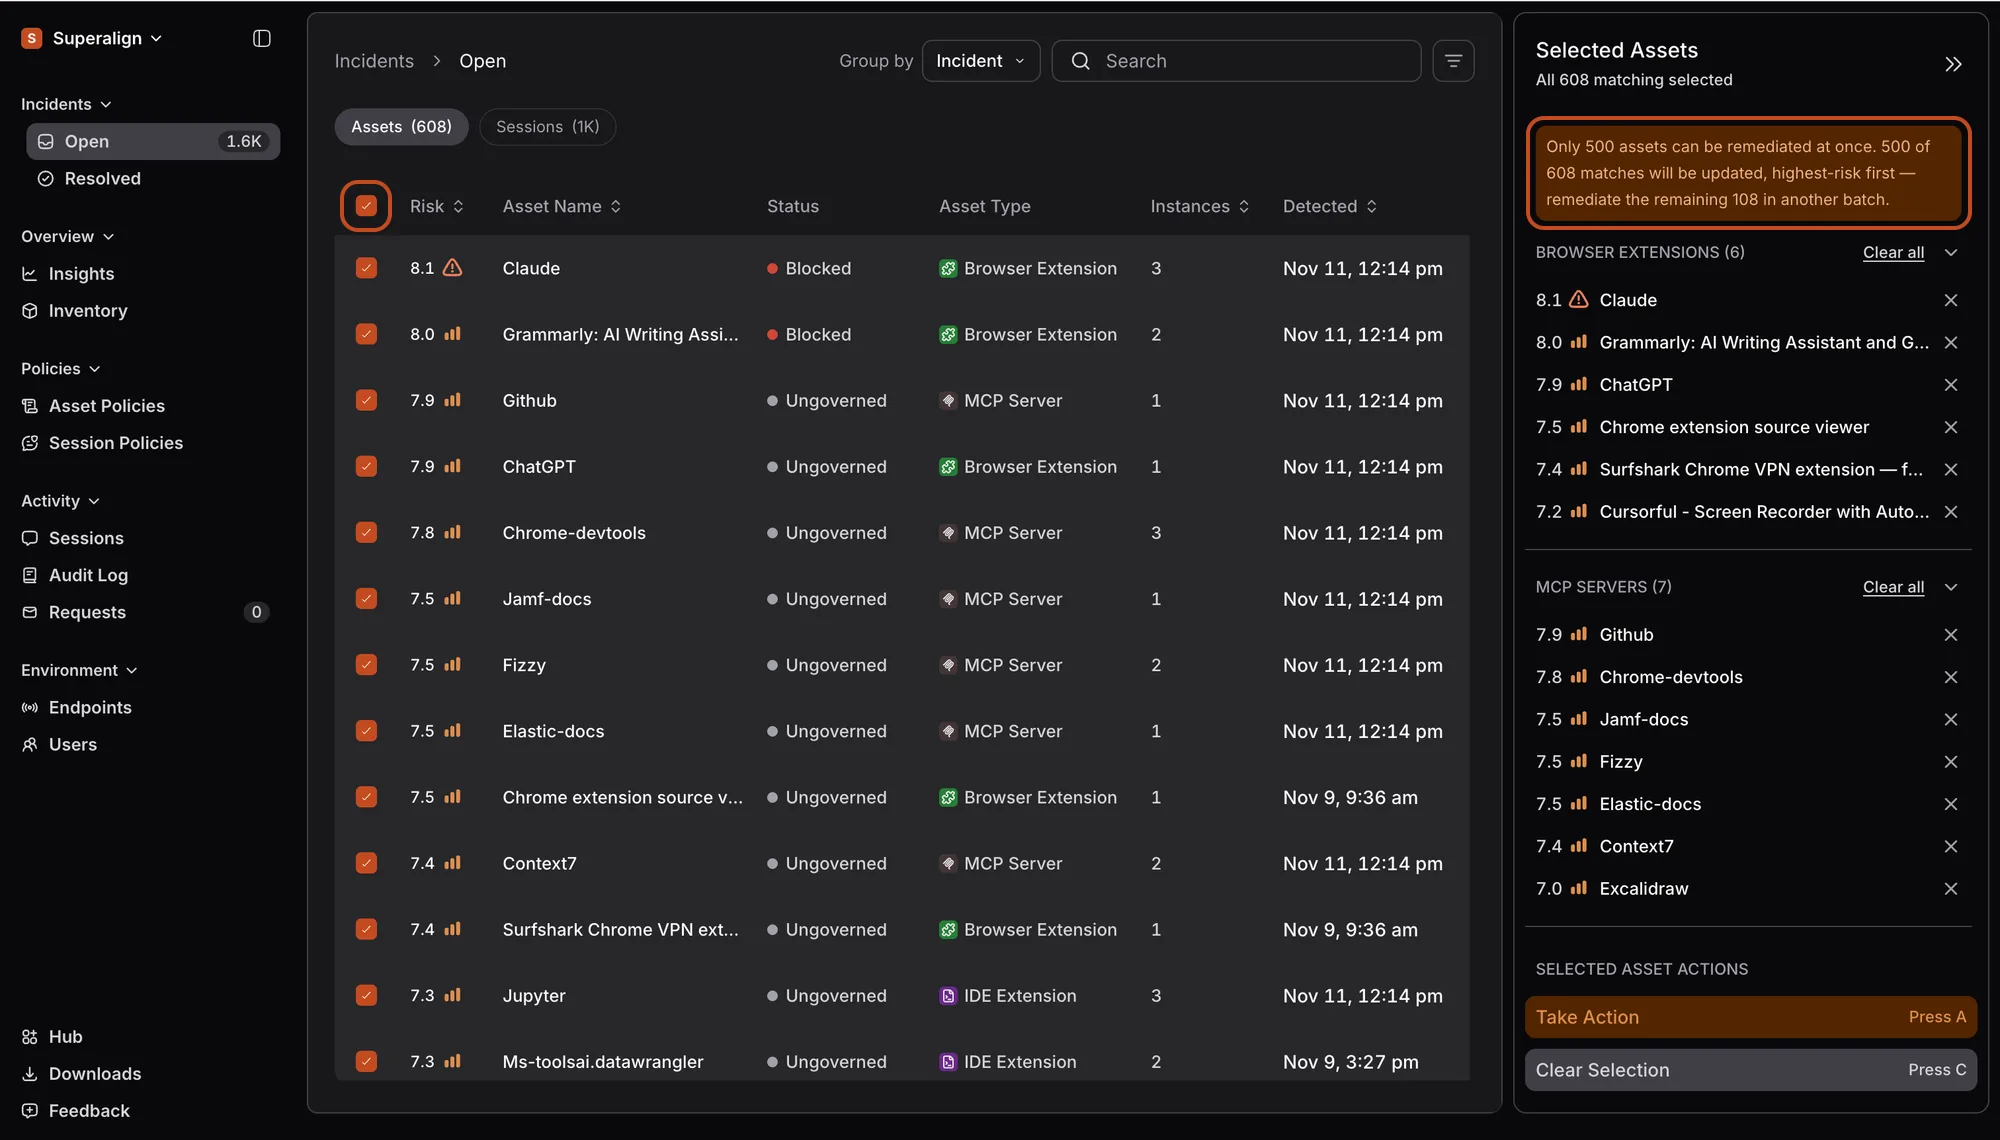
Incidents now opens on a full-width table, and the sidebar stays open. Tick the boxes next to several assets or sessions, or the box at the top to select every incident that matches your search and filters. A bulk panel then opens on the right where you act on all of them at once. Clicking a row still opens that incident on its own, with the sidebar folded away to give it room. Previously, Incidents opened on a list of cards, and each incident was resolved on its own.
If you selected assets, choose Take Action and then Allow, Warn or Block. Your choice applies to those assets on every device that has them. To leave out some devices, act on one asset by itself. If you selected sessions, choose Take Action and pick how they ended: Handled, Expected or False Positive. Handled is selected to start with, so if that’s right, you only need to confirm.
You can act on up to 500 incidents at a time. If you select more assets than that, the panel tells you, and the 500 with the highest risk go first, as shown above. This works on both the Open and Resolved lists. If you try to leave the page while incidents are still selected, Surface asks before it clears them.
The tables changed a little too. The Person column is now called User. On the Resolved list, each session now shows how it ended, such as Handled, in a new Outcome column. When you resolve many sessions at once, the Audit Log, which records who changed what, shows it as a single entry that lists the sessions.
Filter Session Incidents
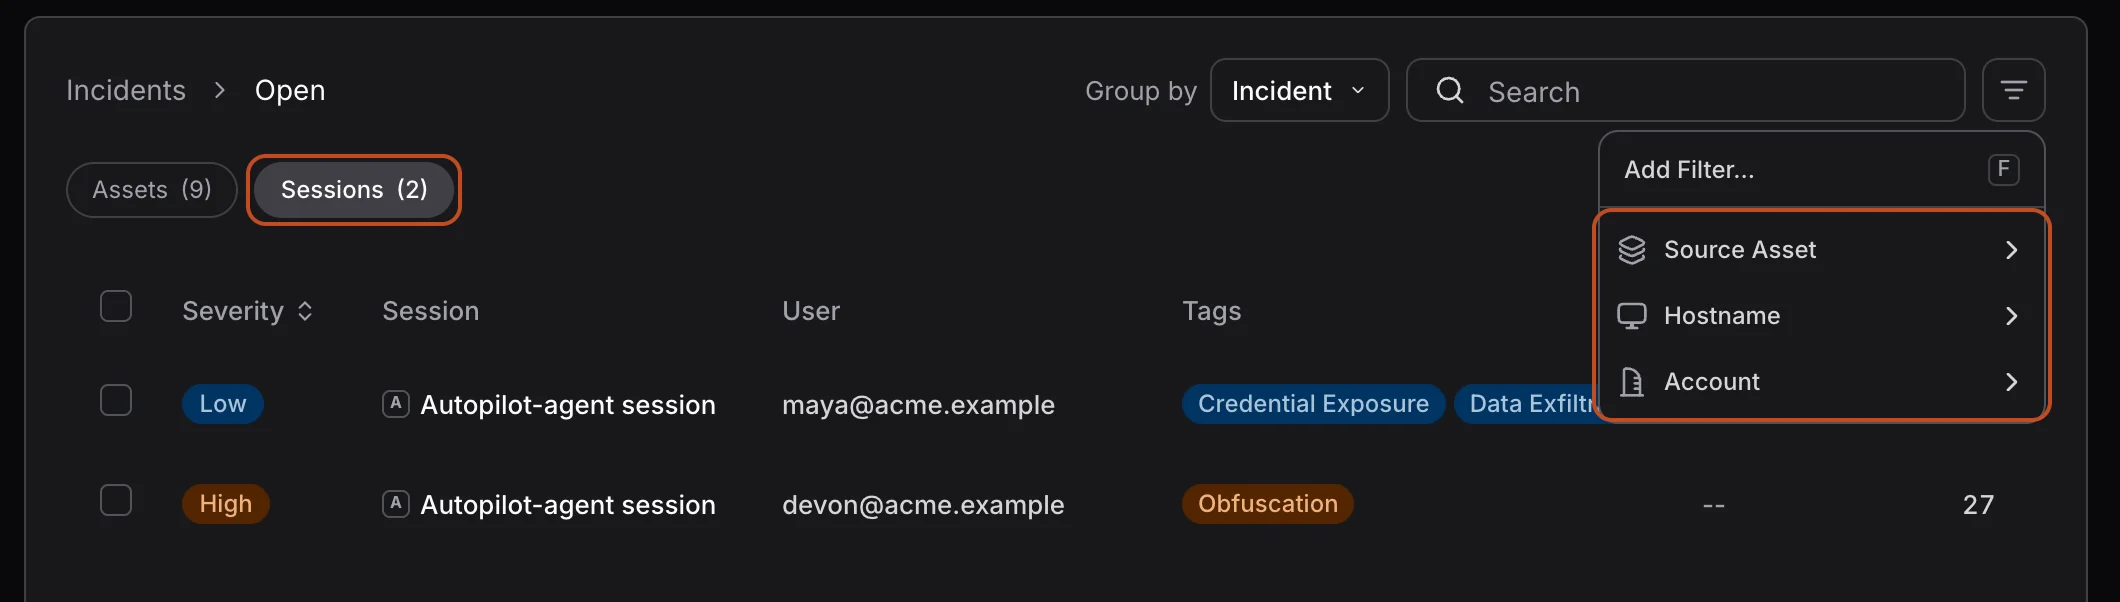
On the Incidents page, the Sessions tab now has three filters, as shown above. Source Asset shows sessions from one AI tool, Hostname shows sessions from one device, and Account shows sessions signed in with a Personal or Company account. Surface remembers the filters you pick the next time you open the page in the same browser.
Personal Accounts Are Masked in Sessions
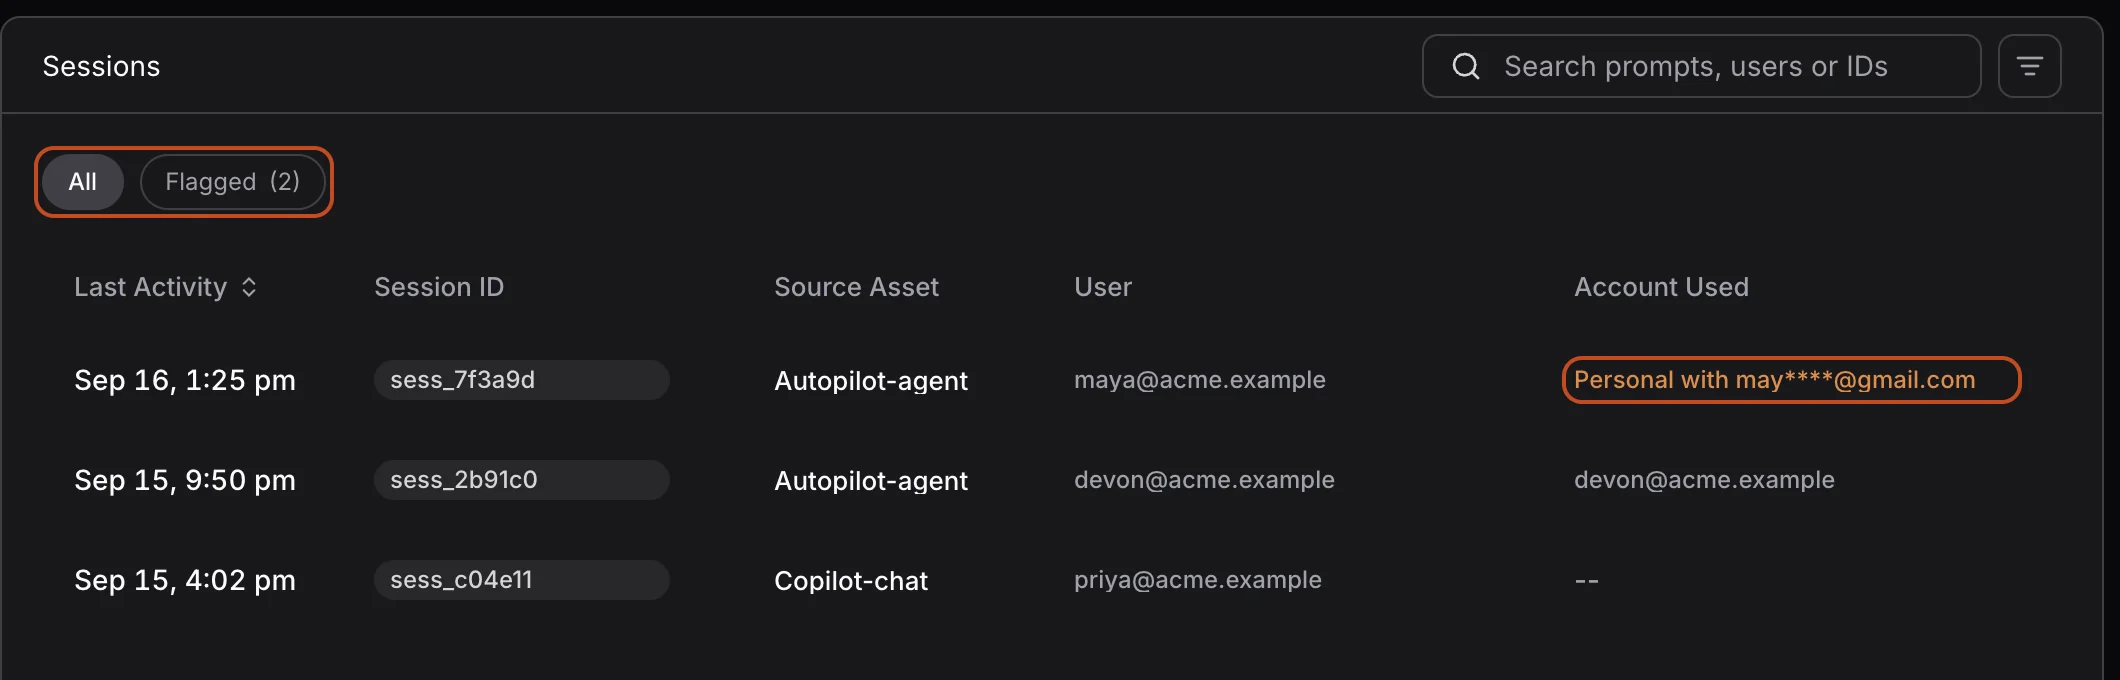
Surface marks a session as personal when the AI tool was signed in with an email from a different domain than the person’s work account. The Sessions page now shows that email partly hidden, for example Personal with may****@gmail.com, as shown above. The full email appears only when an admin chooses Fetch Session, which is recorded in the Audit Log.
Sessions now has two tabs. All lists every session, and Flagged lists the ones with an open incident, so its count matches Open on the Incidents page. Two new filters narrow the list: Account (Personal or Company) and Status (Open or Resolved).
Set Your Own Severity for a Policy
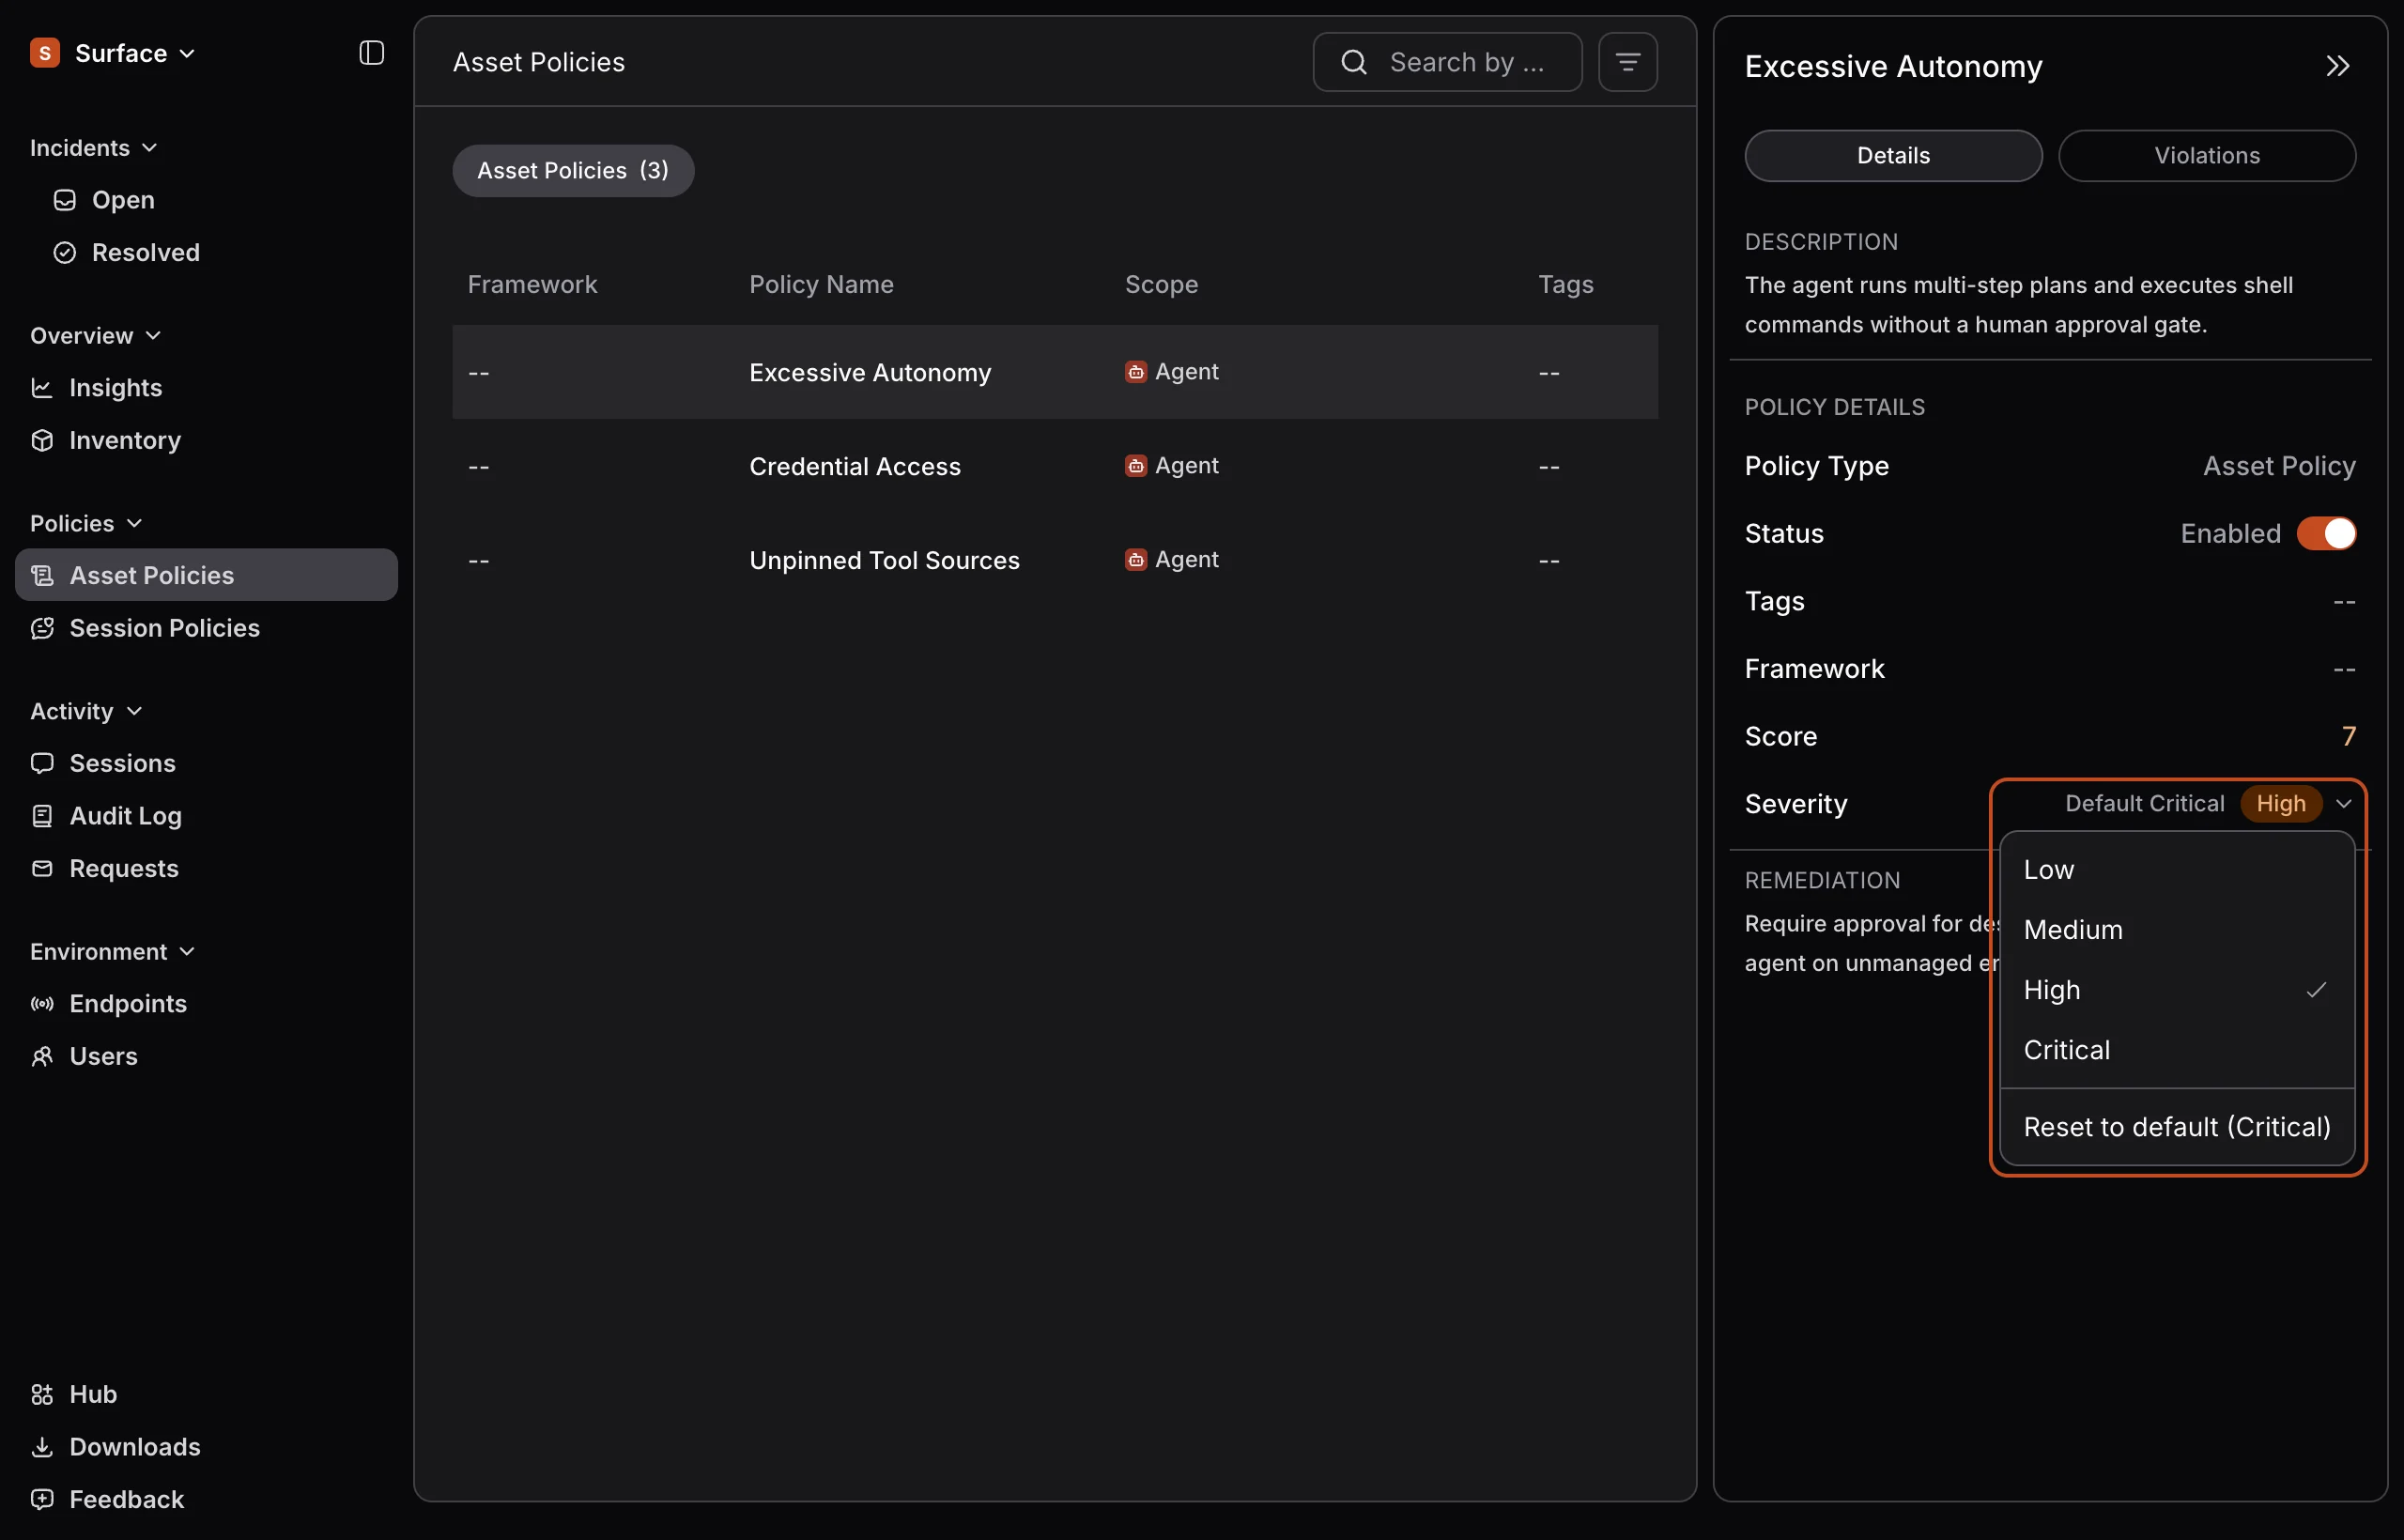
Admins can now change how severe a policy is for their organization. Open a policy and click its Severity in the side panel to pick Low, Medium, High or Critical. A small team might rate a policy lower than the default, while a regulated enterprise might rate it higher.
The change takes effect the next time Surface scans each device. From then on, new risks Surface finds use the severity you picked, and anything it flagged before keeps its old severity. Once you change a policy, its side panel also shows the original severity, such as Default Critical in the image above. To undo your change, choose Reset to default. Every change is recorded in the Audit Log.
Choose Allow, Warn or Block for Session Policies
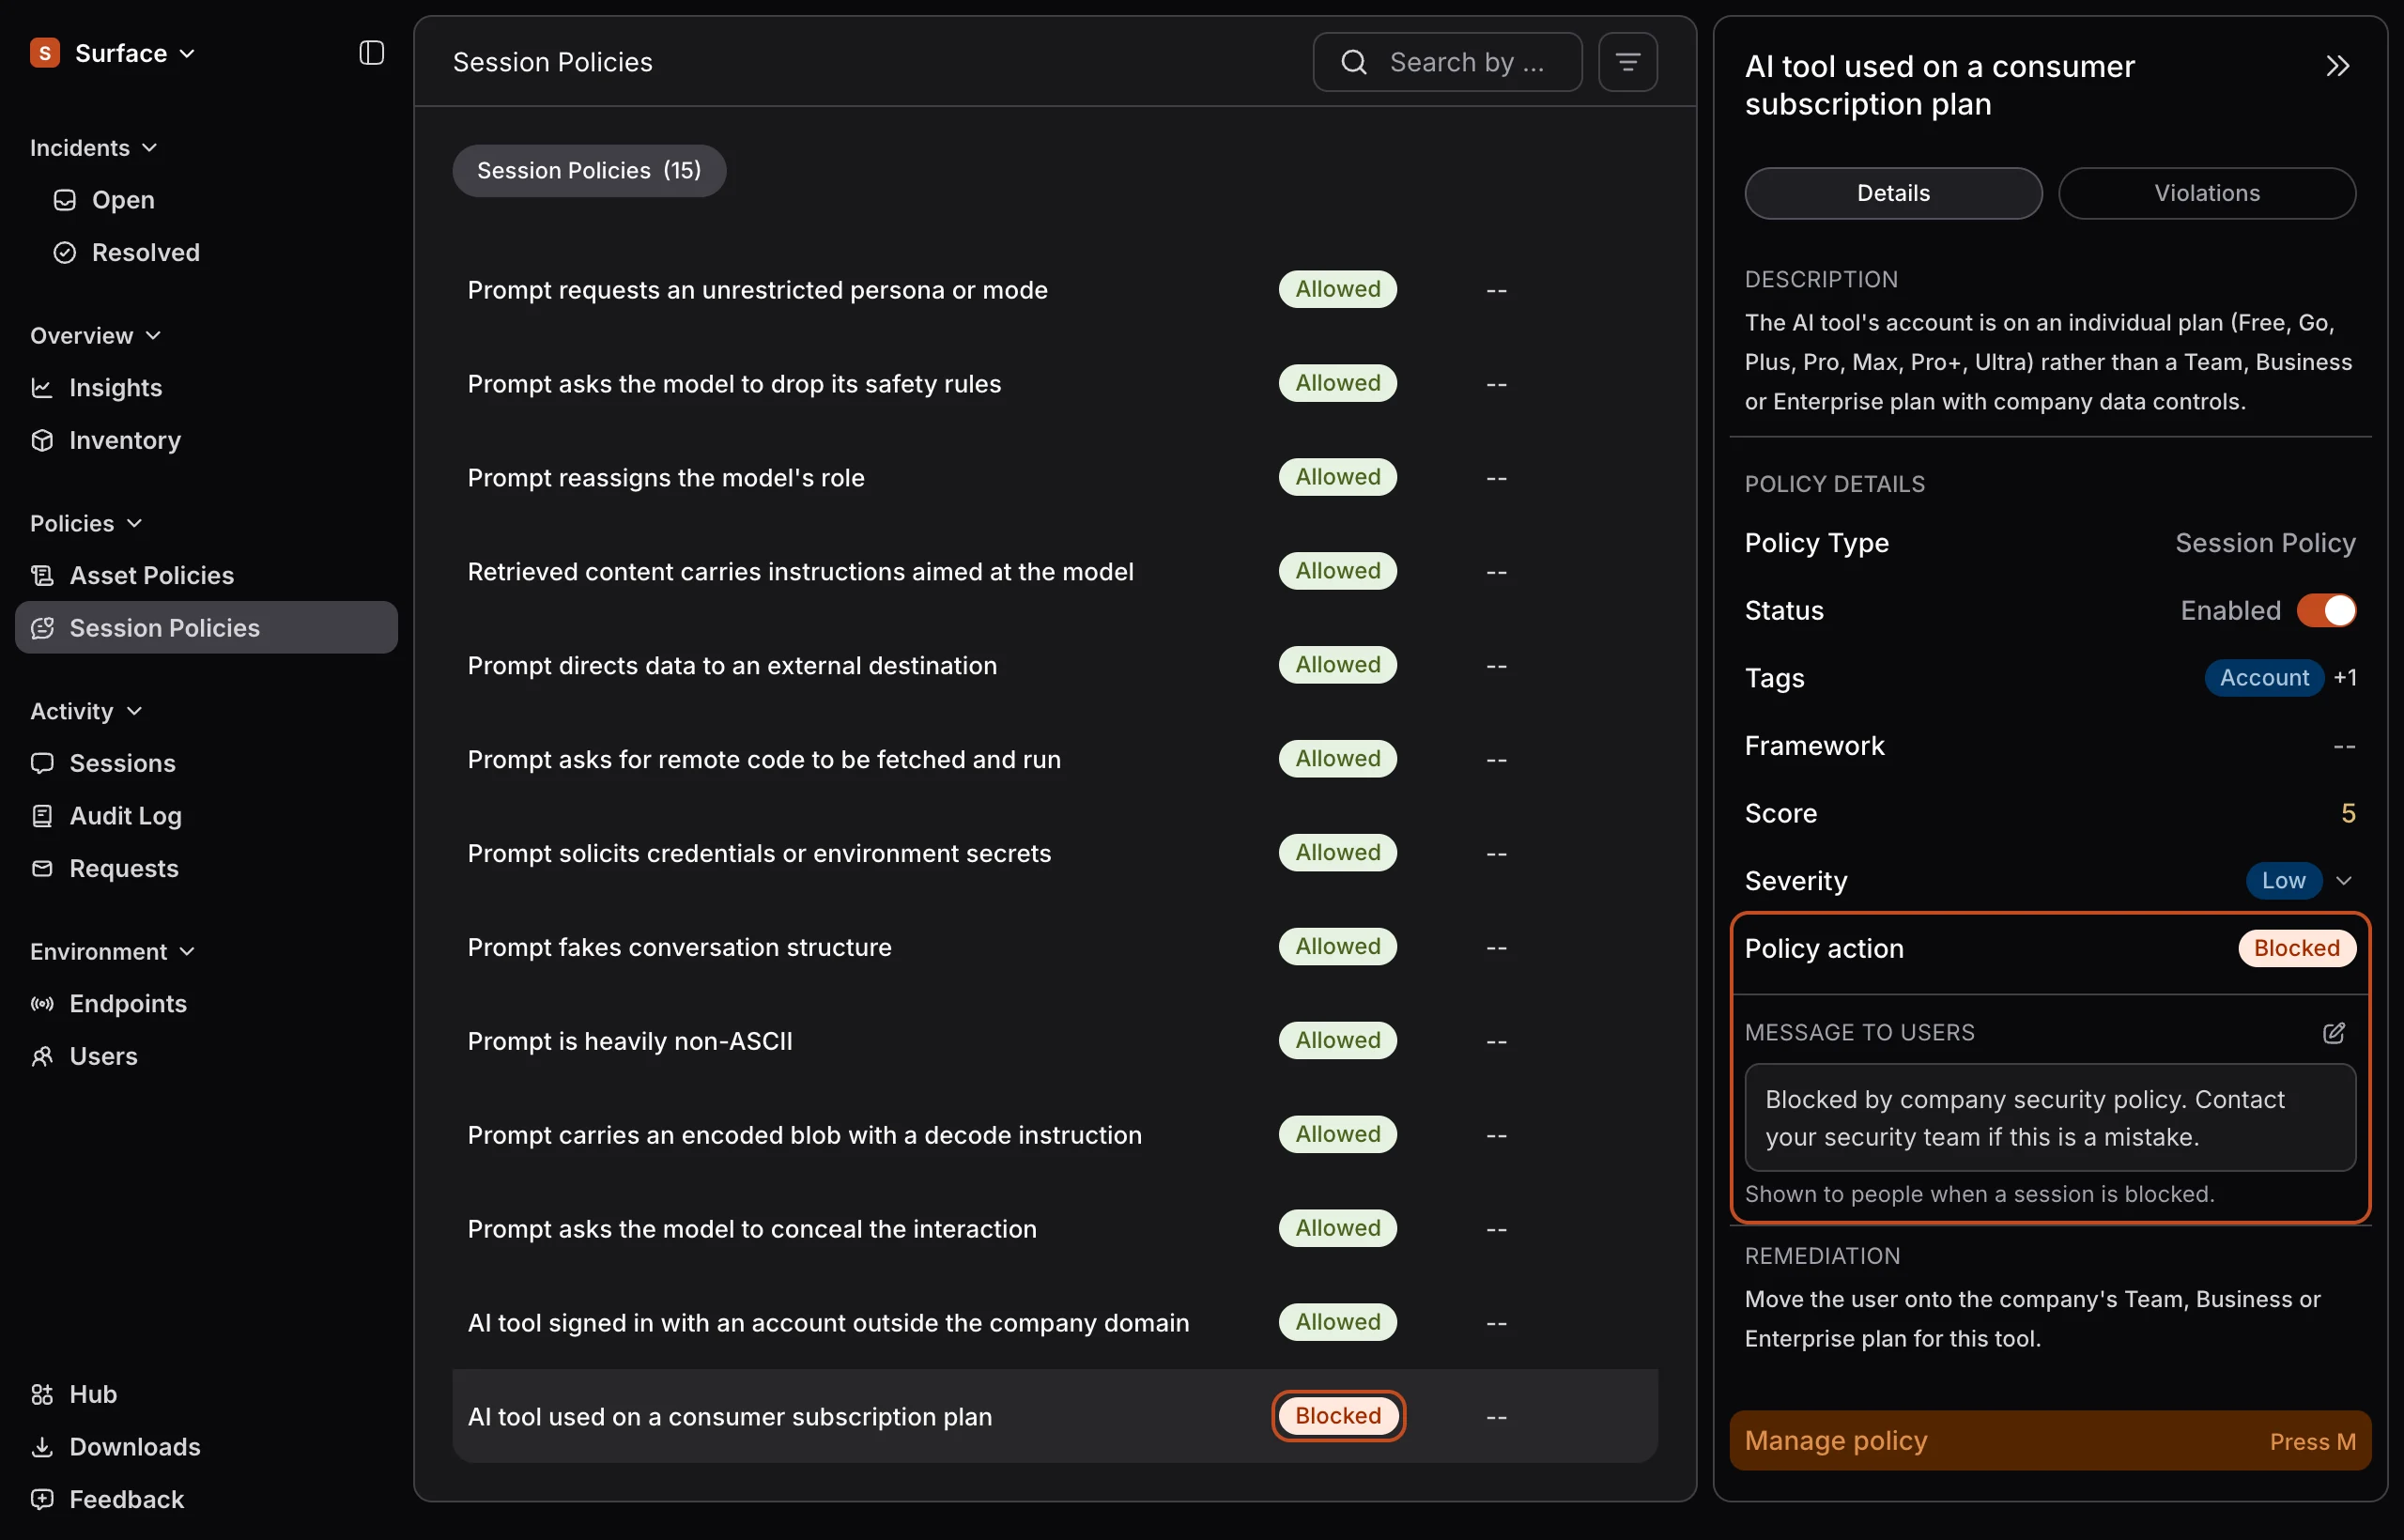
Admins can now choose what should happen when a session policy matches: Allow, Warn or Block. Open a policy on the Session Policies page and choose Manage policy. For Warn and Block, you also write the message people will see, under Message to users, as shown above. Every policy starts as Allowed, and the list shows the choice for each one.
Your choice reaches devices that are online within about a minute. With Warn, people see your message when a session matches the policy, and they can carry on. With Block, the prompt is stopped and they see your message instead. Sessions recorded before the change stay as they were. On the Incidents page, a new Enforcement column shows what a policy did to each session.
See a Full Month of AI Usage
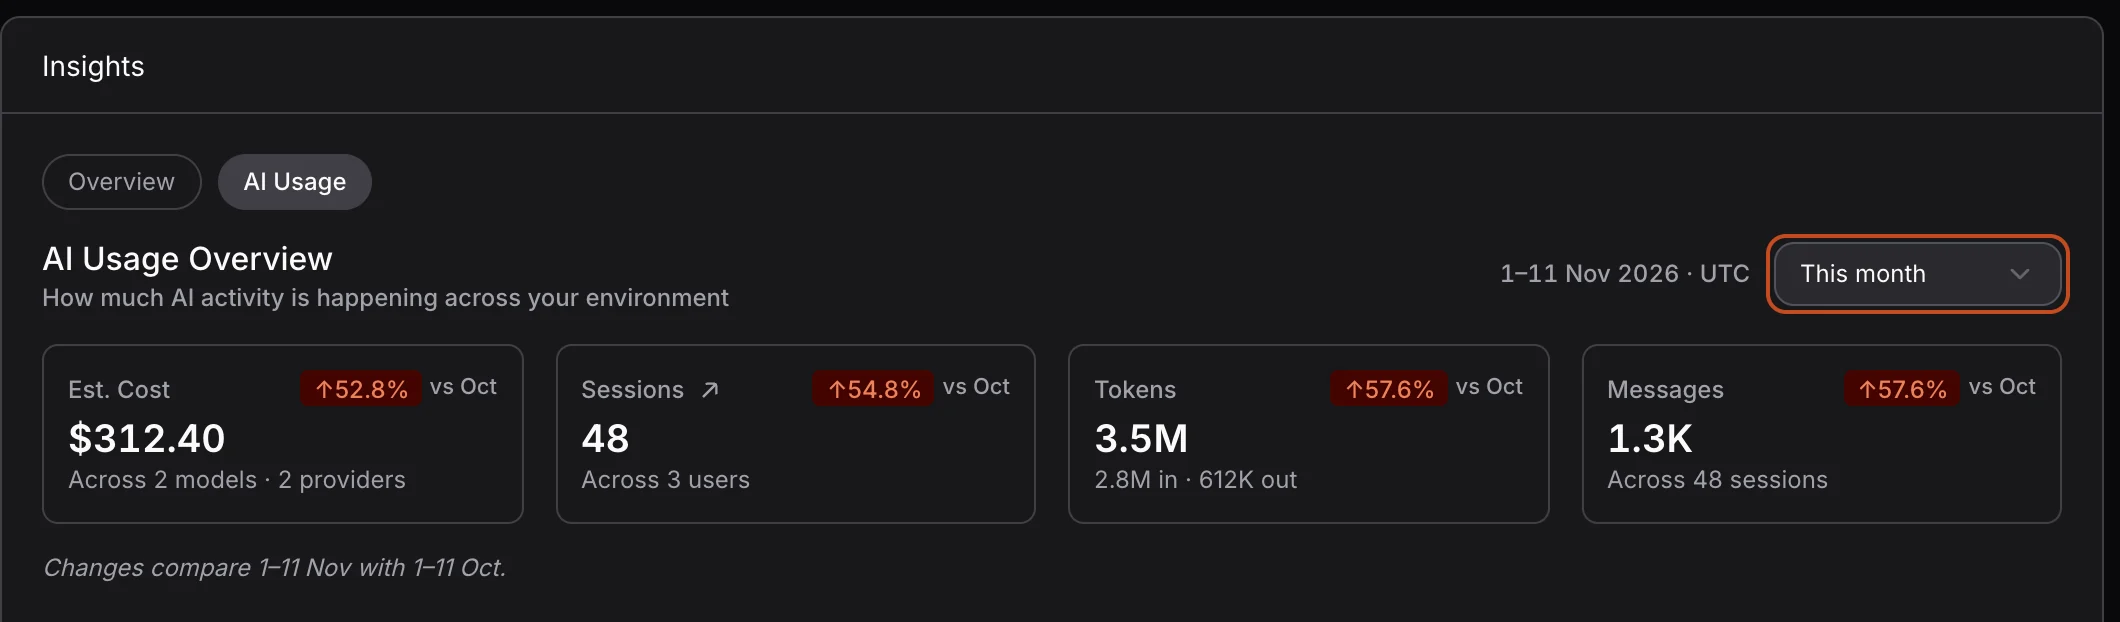
On Insights › AI Usage, you can now pick the time range for the whole tab, as shown above. Choose Last 7 days or This month, and the four cards, both charts and Top Adopters all update to match.
This month counts from the 1st of the month, in UTC, and compares it with the same days last month, for example vs Oct in November.
Introducing Dark Mode
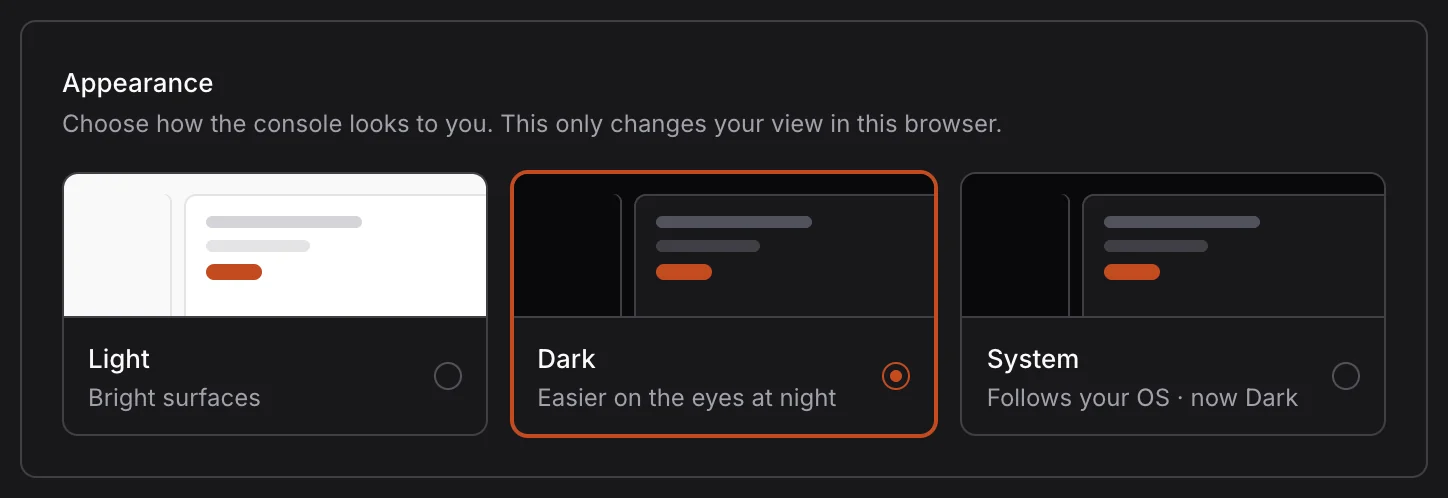
The console now has a dark theme. Open Settings and, under Appearance, pick Light, Dark or System, which follows your computer’s setting. The choice is saved in your browser, so each browser keeps its own.
Surface
Join an Organization With an Enrollment Token
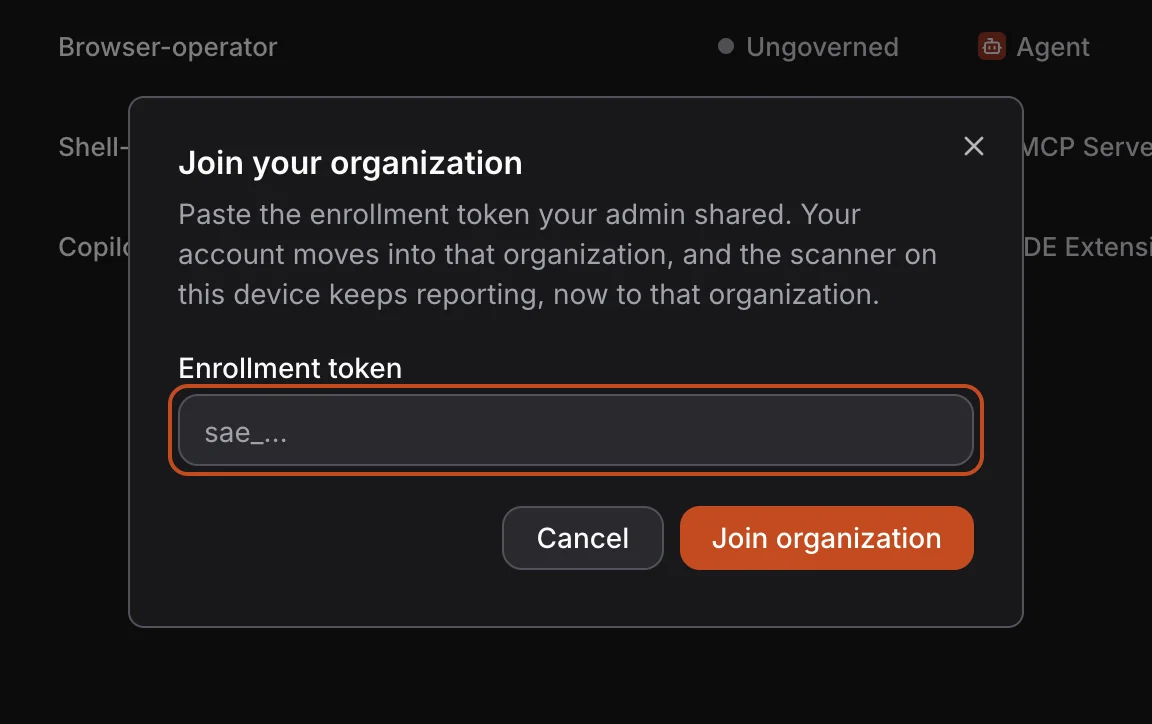
Signing in with a company email no longer adds you to that company’s organization on its own, so only people an admin lets in take a seat. The first person from a company creates its organization and becomes its admin. Everyone after that joins with an enrollment token from an admin. Until then, they land in a shared default organization where they see only their own data.
To join, choose Join organization in the account menu and paste the token, as shown above. Your account and laptop move into the organization, and everything the laptop reported so far moves with them.
The Surface installers now ask for the token and your work email: an Enrollment step in the Mac installer, a dialog in the Windows installer, and a prompt in the Linux and command-line installs. With a valid token, the laptop enrolls without opening a browser to sign in. If the token doesn’t work, the installer falls back to the browser sign-in, and you can join the right organization later from the account menu.